Sunday 23 June 2013

IR spectroscopy detects that oxygen defects act as active centres
oxygen defects act as active centres
 In
the chemical industry, heterogeneous catalysis is vital for the
manufacture of basic or fine chemicals, in catalytic converters of
exhaust gas and for the chemical storage of solar energy. A new infrared
spectroscopy method can study processes at surfaces of oxides used as
catalysts.
In
the chemical industry, heterogeneous catalysis is vital for the
manufacture of basic or fine chemicals, in catalytic converters of
exhaust gas and for the chemical storage of solar energy. A new infrared
spectroscopy method can study processes at surfaces of oxides used as
catalysts.In the chemical industry, heterogeneous catalysis is vital for the manufacture of basic or fine chemicals, in catalytic converters of exhaust gas and for the chemical storage of solar energy. Scientists from the Karlsruhe Institute of Technology (KIT) and Ruhr-Universität Bochum (RUB) in Germany have developed a new infrared spectroscopy method in order to study processes at surfaces of oxides used as catalysts; their results have been published in Angewandte Chemie (doi: 10.1002/ange.201200585).
http://www.spectroscopyeurope.com/news/research/3106-ir-spectroscopy-detects-that-oxygen-defects-act-as-active-centres
Tuesday 18 June 2013
Simple method for identifying incorrect structures of organic molecules due to NMR misassignments
 |
|
 |
Simple method for identifying
incorrect structures of organic molecules due to NMR misassignments
|
Saturday 15 June 2013
ORGANIC SPECTROSCOPY SOLVED PROBLEM-CAMPHOR
SOLVED PROBLEM-CAMPHOR

CAMPHOR,
SEE ALL AT
https://sites.google.com/site/anthonycrastospectroscopy/1d-solved-problem-camphorWednesday 12 June 2013
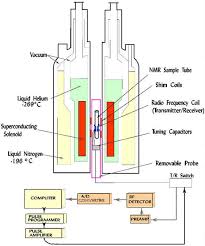
1 H NMR BASICS
1 H NMR BASICS
Hydrogen NMR
There are three isotopes of hydrogen used in NMR spectroscopy:
1Hydrogen, 2Deuterium and 3Tritium. Each isotope resonates at a very different frequency for example if 1H resonates at 400 MHz then 2H resonates at 61.402 MHz. Only one isotope is observed at a time because the spectrometer transmits and receives over a very limited frequency range. The chemical shift ranges for all three nuclei are virtually identical and can be used for preliminary analysis but there the similarity ends. 3Tritium is not commonly measured by NMR because it is radioactive.
Each type of signal has a characteristic chemical shift range (fig. 1)
that can be used for initial assignment.
Fig. 1. Chemical shift ranges of protons
according to their chemical environment 
Choose the structure that most closely represents the hydrogen in question.
R = alkyl or H, Ar = aryl. 1Hydrogen (Proton) NMR
The 1D 1H (Proton) NMR experiment is the most common NMR experiment.
The proton (1Hydrogen nucleus) is the most sensitive nucleus apart from tritium) and usually yields sharp signals. Even though its chemical shift range is narrow, its sharp signals make proton NMR very useful.
A typical analysis of a 1H NMR spectrum may proceed as follows:
The
number of protons of each type in the spectrum of a pure sample
can be obtained directly from the integrals of each multiplet. This is only true if the multiplets are well separated and do not overlap the solvent or residual water signals and provided that the molecule is not undergoing slow conformational exchange. A routine NMR spectrum yields integrals with an accuracy of +/-10%. Accuracies of +/-1% can be achieved by increasing the relaxation delay to five times the longitudinal relaxation time (T1) of the signals of interest. Where multiplets overlap, the total integral of the spectral region may be used.
From the table of the proton chemical shifts one obtains information about
each type of proton and can carry out a preliminary assignment.
Consider ethanol as an example (Fig. 2).
Using chemical shifts, the peak at 1.2 ppm is in the expected range for CH3 (methyl) and at 3.7 and 3.9 ppm are compatible with CH2 (methylene). The chemical shift of OH is very dependent on solvent and other experimental conditions so cannot be assigned by chemical shift alone.
Using integration, we expect CH3 to have an integral of three,
CH2 to have an integral of two and OH to have an integral of one. This is the case and so the assignment is complete.
Fig. 2. 1H NMR spectrum of ethanol in CDCl3

For
other molecules this is not sufficient and the multiplet structure is
needed to
complete the assignment. The multiplets (fig. 3) arise from spin-spin couplings that are transmitted through chemical bonds and yield information about the immediate molecular environment. In the case of CH3 and OH, they are split by the two neighboring protons of the CH2 to yield a triplet pattern called AX2. (Click here to see a list of common homonuclear splitting patterns and a description of heteronuclear coupling.) The CH2 is split by the single OH proton and the three CH3 protons to form the AX3Y pattern.
Fig. 3. Multiplet structures from the 1H NMR
spectrum of ethanol in CDCl3 
Having
determined the multiplicity, one may measure the coupling constants.
These are measured in Hz (not ppm), as they are field independent. If you find that two (and only two) multiplets contain the same coupling constant then you know that they arise from nearby protons. The coupling constant gives an indication of the distance between the protons. In general 10 to 18 Hz means two bond or three bond trans to a C=C double bond. Coupling constants between 1 to 10 Hz indicate three-bonds or more bonds if delocalized. Less than 1 Hz usually means four or more bonds.
In addition to homonuclear couplings, the multiplets may be split by other nuclei such as 19Fluorine or 31Phosphorus. (If suchheteronuclear couplings are undesirable they may be decoupled.
The best pulse sequence in such a case is that for inverse gated decoupling.) Properties of 1H
2Deuterium NMR
2Deuterium
(heavy hydrogen) NMR is usually used for field frequency lock.
At natural abundance it has very low sensitivity but when enriched it is of medium sensitivity. Deuterium usually yields broad signals whose line width typically varies between a few hertz and a few kilohertz. The spectrum has the same narrow chemical shift range as for 1H but its low resolution and lower sensitivity make it a poor alternative. Deuterium-deuterium couplings are about 40 times smaller that proton-proton couplings and are therefore not observed. However, in partially deuterated molecules small proton-deuterium couplings can be obseved. The main use of deuterium spectra is for determining the effectiveness of chemical deuteration (fig. 4).
Fig. 4. 1H and 2H NMR spectra of
Amphetamine sulfate–d3 showing successful specific deuteration of the methyl  Properties of 2H
3Tritium NMR
3T is the only nucleus more sensitive than proton
(1H). Being a spin-½ isotope of hydrogen, spectra of fully tritiated compounds look similar to 1H with effectively the same chemical shifts but with slightly higher sensitivity, dispersion and coupling constants. However, 3T is very radioactive so most NMR studies are carried out with partially and specifically labeled compounds. Properties of 3H
| ||||||||||||||||||||||||||||||||||||||||||||||||||||||||||||||||||||||||||
Tuesday 11 June 2013
Carbon-13 NMR
Carbon-13 NMR (13C NMR or sometimes simply referred to as carbon NMR) is the application of nuclear magnetic resonance (NMR) spectroscopy to carbon. It is analogous to proton NMR (1H NMR) and allows the identification of carbon atoms in an organic moleculejust as proton NMR identifies hydrogen atoms. As such 13C NMR is an important tool in chemical structure elucidation in organic chemistry. 13C NMR detects only the 13C isotope of carbon, whose natural abundance is only 1.1%, because the main carbon isotope,12C, is not detectable by NMR since it has zero net spin.


Implementation
13C NMR has a number of complications that are not encountered in proton NMR. 13C NMR is much less sensitive to carbon than 1H NMR is to hydrogen since the major isotope of carbon, the 12C isotope, has a spin quantum number of zero and so is not magnetically active and therefore not detectable by NMR. Only the much less common 13C isotope, present naturally at 1.1% natural abundance, is magnetically active with a spin quantum number of 1/2 (like 1H) and therefore detectable by NMR. Therefore, only the few 13C nuclei present resonate in the magnetic field, although this can be overcome by isotopic enrichment of e.g. protein samples. In addition, thegyromagnetic ratio (6.728284 107 rad T−1 s−1) is only 1/4 that of 1H, further reducing the sensitivity. The overall receptivity of 13C is about 4 orders of magnitude lower than 1H.
[1]

[1]
Another potential complication results from the presence of large one bond J-coupling constants between carbon and hydrogen (typically from 100 to 250 Hz). In order to suppress these couplings, which would otherwise complicate the spectra and further reduce sensitivity, carbon NMR spectra are proton decoupled to remove the signal splitting. Couplings between carbons can be ignored due to the low natural abundance of 13C. Hence in contrast to typical proton NMR spectra which show multiplets for each proton position, carbon NMR spectra show a single peak for each chemically non-equivalent carbon atom.
In further contrast to 1H NMR, the intensities of the signals are not normally proportional to the number of equivalent 13C atoms and are instead strongly dependent on the number of surrounding spins (typically 1H). Spectra can be made more quantitative if necessary by allowing sufficient time for the nuclei to relax between repeat scans.


High field magnets with internal bores capable of accepting larger sample tubes (typically 10 mm in diameter for 13C NMR versus 5 mm for 1H NMR), the use of relaxation reagents,[2] for example Cr(acac)3 (chromium (III) acetylacetonate, CAS number 21679-31-2), and appropriate pulse sequences have reduced the time needed to acquire quantitative spectra and have made quantitative carbon-13 NMR a commonly used technique in many industrial labs. Applications range from quantification of drug purity to determination of the composition of high molecular weight synthetic polymers.
13C chemical shifts follow the same principles as those of 1H, although the typical range of chemical shifts is much larger than for 1H (by a factor of about 20). The chemical shift reference standard for 13C is the carbons in tetramethylsilane (TMS), whose chemical shift is considered to be 0.0 ppm.

Typical chemical shifts in 13C-NMR
DEPT spectra

DEPT stands for Distortionless Enhancement by Polarization Transfer. It is a very useful method for determining the presence of primary, secondary andtertiary carbon atoms. The DEPT experiment differentiates between CH, CH2and CH3 groups by variation of the selection angle parameter (the tip angle of the final 1H pulse):
- 135° angle gives all CH and CH3 in a phase opposite to CH2
- 90° angle gives only CH groups, the others being suppressed
- 45° angle gives all carbons with attached protons (regardless of number) in phase

Signals from quaternary carbons and other carbons with no attached protons are always absent (due to the lack of attached protons).
The polarization transfer from 1H to 13C has the secondary advantage of increasing the sensitivity over the normal 13C spectrum (which has a modest enhancement from the NOE (Nuclear Overhauser Effect) due to the 1H decoupling).
APT spectra
Another useful way of determining how many protons a carbon in a molecule is bonded to is to use an Attached Proton Test, which distinguishes between carbon atoms with even or odd number of attached hydrogens. A proper spin-echo sequence is able to distinguish between S, I2S and I1S, I3S spin systems: the first will appear as positive peaks in the spectrum, while the latter as negative peaks (pointing downwards), while retaining relative simplicity in the spectrum since it is still broadband proton decoupled.
Even though this technique does not distinguish fully between CHn groups, it is so easy and reliable that it is frequently employed as a first attempt to assign peaks in the spectrum and elucidate the structure.[3]
- ^ R. M. Silverstein, G. C. Bassler and T. C. Morrill (1991). Spectrometric Identification of Organic Compounds. Wiley.
- ^ Caytan, Elsa; Remaud, Gerald S.; Tenailleau, Eve; Akoka, Serge, GS; Tenailleau, E; Akoka, S (2007). "Precise and accurate quantitative 13C NMR with reduced experimental time". Talanta 71 (3): 1016–1021. doi:10.1016/j.talanta.2006.05.075. PMID 19071407
- ^ Keeler, James (2010). Understanding NMR Spectroscopy (2nd ed.). John Wiley & Sons. p. 457. ISBN 978-0-470-74608-0.
- Carbon NMR spectra, where there are three spectra of ethyl phthalate, ethyl ester of orthophthalic acid: completely coupled, completely decoupled and off-resonance decoupled (in this order).
- For an extended tabulation of 13C shifts and coupling constants.

Monday 10 June 2013
Raman Imaging Breaks The Nanometer Barrier

Raman
Imaging Breaks The Nanometer Barrier
Spectroscopy:
Chemical analysis technique uses double-resonance approach to zoom in on single
molecules. and corresponding theoretical simulation of a substituted porphyrin.")
An experimental TERS image (top left) of a single porphyrin
molecule (right) and its theoretical simulation (bottom left).
Credit: Guoyan Wang & Yan Liang
Subscribe to:
Posts (Atom)